Data visualization through mapping has become a primary way for cities to leverage the data gathered from various smart technologies or applications. Geographic information system (GIS) maps provide easily digestible visuals that can help cities determine areas in need of certain amenities or services, and the best plans for resource distribution.
Along with the explosion of municipal data analytics comes an influx of mapping tools. Some of them are for very niche analyses — such as tracking a city's opioid overdoses — and others are for more widespread analyses — such as repairs needed throughout a city. Many of these applications go beyond just plotting existing data and also provide predictive analytics to help prevent and solve cities' future problems.
Smart Cities Dive examined a handful of the many available mapping tools to see how they're being used to benefit U.S. cities.
ArcGIS
Esri's powerhouse mapping tool is generally considered the tried-and-true granddaddy of them all, used by many local and state governments to track and map a variety of datasets. Los Angeles used it to build its GeoHub, which provides various data visualization maps, including rankings of each street's cleanliness based on sanitation department data and a map of construction projects that are permitted or underway. California's Office of Emergency Services uses the mapping tool for real-time tracking of disasters and emergencies, and to deploy resources quickly and effectively.
Builder
The easy analysis tool from Carto boasts a simple drag-and-drop interface that's simple enough for non-coders to use. San Diego leveraged the tool to devise Streets SD, an interactive map showing the progress of road repairs that allows users to break down the data to show projects by year and by the type of road repair: concrete, asphalt/overlay/inlay or slurry seal.
MetroGraph
Kansas City, MO has positioned itself a smart city leader, largely by analyzing data through its Xaqt platform. The platform, which ingests data from multiple sources — including sensors installed throughout the city — creates predictive, real-time data visualizations. It's the force behind Kansas City's much talked about pothole prediction pilot that launched last year. "That's helping us to save quite a bit of money in the street maintenance department," Kansas City Chief Innovation Officer Bob Bennett told Smart Cities Dive.
This is one of the many examples of cities working with solutions developers to solve urban problems, because Xaqt didn't have a pothole prediction tool but collaborated with the city to build one. Kansas City uses the platform to pilot other types of anomoly detection as well, such as traffic accident prediction.
Hopper
This risk and danger prediction tool from Open Data Nation, which can be integrated with Microsoft and Esri products, aims to prevent safety problems before they pop up. It uses machine learning techniques to predict, for example, in which areas restaurants are likely to fail inspections. It also uses road condition data with machine learning to predict where serious traffic accidents might occur. Hopper aims to provide 100 cities with predictive analytics by the end of this year, and it plans to unveil more uses for its platform throughout the year, according to State Scoop.
ODMap
This app, developed by the Washington/Baltimore division of the High Intensity Drug Trafficking Areas (HIDTA) program and launched last year, provides real-time overdose surveillance data mapping across jurisdictions that can alert users to a local overdose spike. First responders enter data, including if an overdose was fatal or non-fatal and if an antidote was administered, and public health and safety staff can view the map on a secure server.
The map "allows us to focus in on the greatest areas of need," Jeff Beeson, head of the Washington/Baltimore HIDTA program, told Smart Cities Dive. He explained that 27 states are actively entering data, receiving weekly updates and receiving overdose spike alerts as they occur, and none of the data is personal identification information, therefore the service is HIPAA compliant. HIDTA also developed an API to allow city agencies with native record maps to feed data straight to the OD Map.
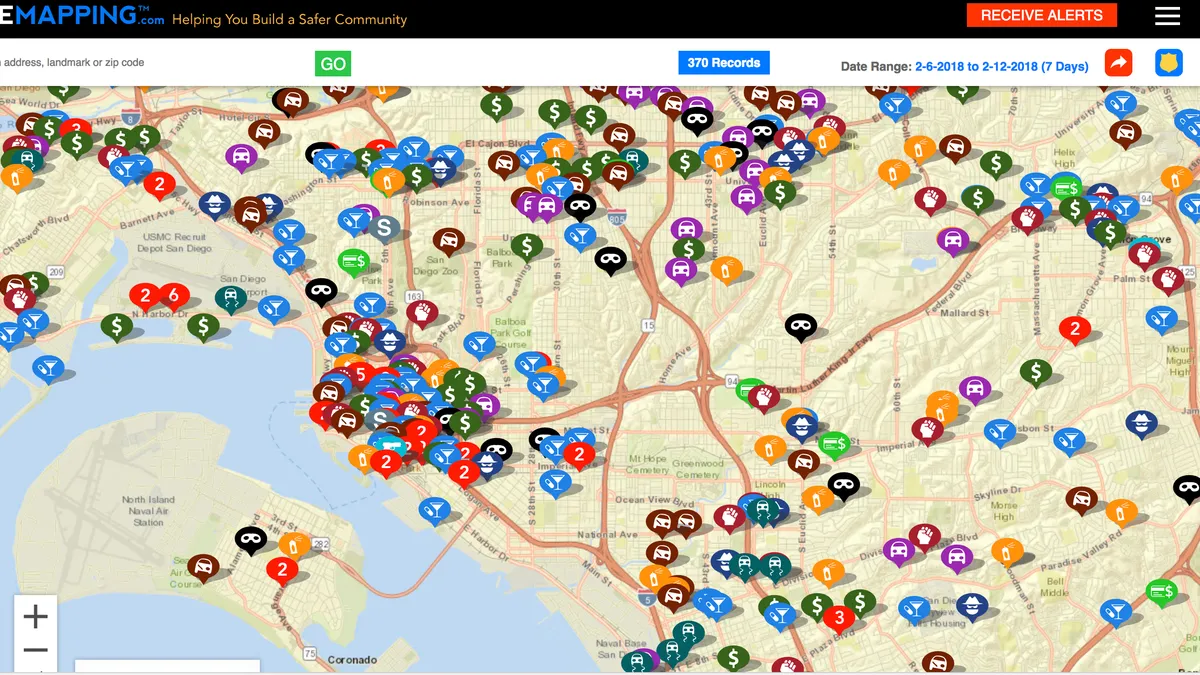
CrimeMapping.com
This web-based platform is a specialty public safety tool from TriTech Software Systems that compiles crime statistics for participating jurisdictions, with the goal of reducing crime through information availability and community policing. The local crime data is loaded into the system and appears on public-facing mobile or desktop apps. Incidents are pinpointed on the map and can be sorted by type and location, and app subscribers can get email alerts. San Jose, CA, Kalamazoo, MI and Greensboro, NC are among the cities that display their crime data via the tool.


