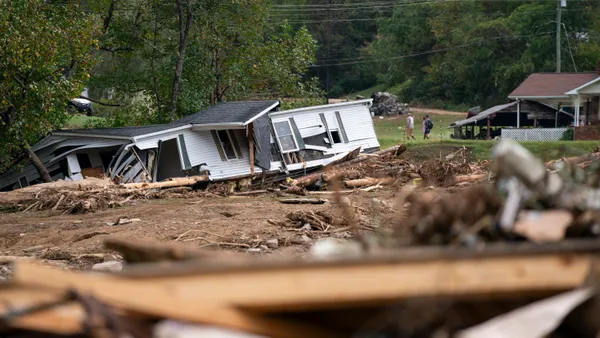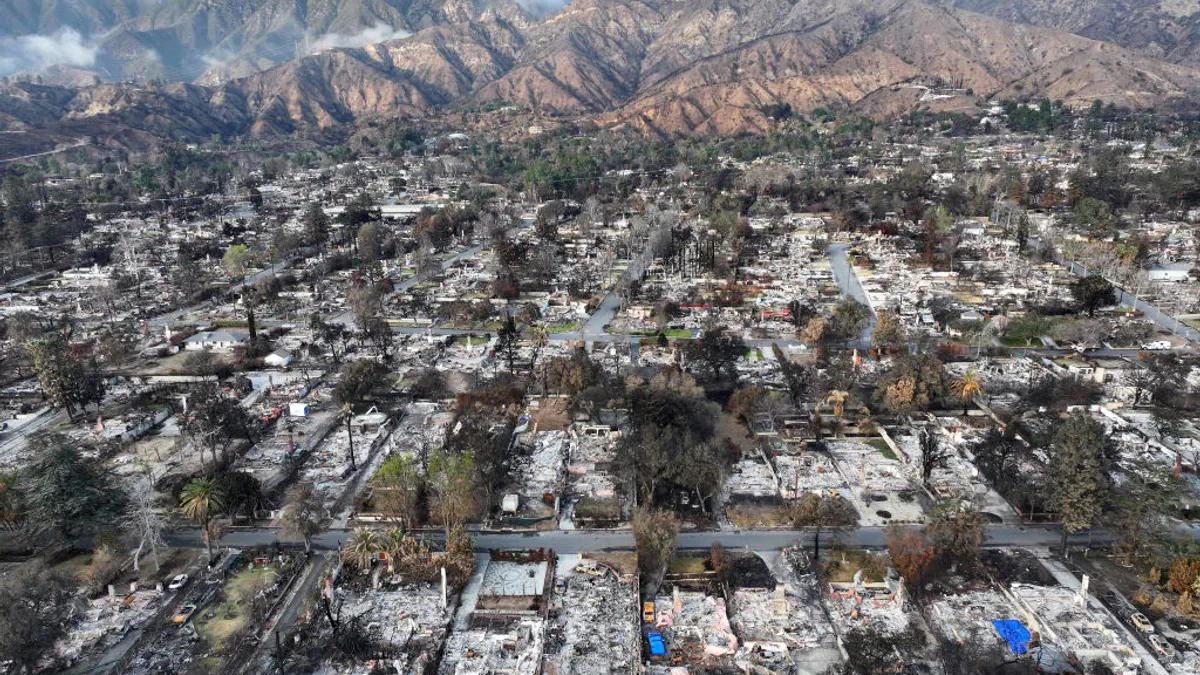
As wildfires ravaged the Los Angeles area in January, some residents evacuated, others opened their homes to family and friends and many became citizen scientists, using their phones to check the air quality around them.
Historically, air quality monitoring was the domain of regulatory bodies like the Environmental Protection Agency, which sets national standards for measuring and improving air quality and reducing pollution and communicates the air quality via the Air Quality Index. The EPA installs air quality monitors in areas that are densely populated or at high risk of pollution, but such monitors are by no means ubiquitous. Due in part to the price of these high-quality instruments, only about a third of U.S. counties have these monitors.
But with rapid advancements in air quality sensors over the past several years, communities are now home to networks of lower-cost sensors that collect and share air quality data essential to public health. New research also suggests that air quality data collection will only improve.
Better sensors with lower costs
“We're at a point now where if a community had a few tens of thousands of dollars, it could install a community air quality network and get reasonably good results,” said Charlie Catlett, a senior computer scientist at the U.S. Department of Energy's Argonne National Laboratory, who first started an urban sensor pilot project in Chicago about a decade ago. Back then, Catlett said in a recent interview, air quality sensors were much more expensive. Plus, those that were commercially available were geared toward the household, not the community level, he said.
Today, sensors are not only cheaper, but many are designed to present a picture of air quality across communities.
While cities from New Haven, Connecticut, to Sandy City, Utah, have installed their own air quality sensor networks, these networks have also sprung up in other communities through the proliferation of simple, consumer-grade sensors belonging to individual households. In the District of Columbia, the local government loans sensors to interested residents with eligible properties.
The South Coast Air Quality Monitoring District, the agency enforcing air quality regulations in the Los Angeles area, has tested hundreds of low-cost sensors to determine their efficacy via its Air Quality Sensor Performance Evaluation Center. “Performance of these sensors varies greatly,” said Andrea Polidori, assistant deputy executive officer of monitoring and analysis at South Coast AQMD. But the sensors that detect particulate matter — particle pollution — “are actually quite decent,” he said.
One such sensor is produced by the company PurpleAir, which updates aggregate, localized air quality data every two minutes on its free maps.
PurpleAir sensors measure PM2.5, fine particulate matter up to 2.5 microns in diameter, small enough to be inhaled and travel into the lungs. PM2.5 makes up roughly 90% of the particulate matter emitted from wildfires.
Over the past several years, sensors like PurpleAir’s have also gotten better at illustrating air quality in a given area, said Karen Clay, professor of economics and public policy at Carnegie Mellon University’s Heinz College of Information Systems and Public Policy. Data hasimproved as sensors have become more common, she said, because “you get much better local data if you have more sensors.”
Air quality inequality
Air quality sensors are not equally distributed in communities, pointing to a role for cities, said Clay.
Some communities “already have pretty dense PurpleAir networks, so in those cases, having [city-provided] monitors may not add a lot of value,” she said.
But cities can make a difference by strategically placing sensors in communities where there are data gaps, Clay said, such as neighborhoods where lower-income residents are less likely to purchase their own sensors.
These communities are also more likely to be affected by PM2.5, according to a 2018 study published in the American Journal of Public Health.
A 2022 study in that journal found that though the number of PurpleAir sensors increased in California between 2017 and 2020, there were fewer sensors in census tracts with higher rates of residents of color, low-income residents and PM2.5 levels.
The study also found that the areas in California with the highest levels of pollution and socioeconomic disadvantage included southern Los Angeles County and areas downwind of it.
A network of air quality networks
PurpleAir’s air quality map shows hundreds of PurpleAir sensors in the Los Angeles area.
Clay said data from low-cost sensors bolsters the government’s more advanced data. Indeed, PurpleAir’s hyperlocal data is now integrated into the air quality reports the EPA provides, such as its AirNow Fire and Smoke Map.
But while current sensors can measure the level of air pollution, they still don’t give a complete, real-time picture of what’s in the air, said Jason Low, deputy executive officer of monitoring and analysis at South Coast AQMD. That’s why it’s important to “communicate to the public the context of air monitoring data,” he said.
The Air Quality Index “is a good indicator for smoke,” Low said, “but there are other compounds [in the air].” The AQI doesn’t take into account all toxic material, such as lead, that could be in the air. And wildfire particulate material is more toxic when fires spread through cities rather than forests because of the burning of man-made materials.
The air quality app maps that many Californians relied on in January essentially show total PM mass concentration, said Roya Bahreini, a professor of atmospheric science at the University of California, Riverside. “But what [an app map] doesn't tell you is what the particulate matter is made of.”
Bahreini is co-principal investigator of the federally funded Atmospheric Science and Chemistry mEasurement NeTwork project, or ASCENT, which continuously monitors aerosol composition at 12 sites nationwide.
During the wildfires, ASCENT’s research-grade monitors captured high levels of toxins, including lead, at the project’s sites in Los Angeles, Riverside and Joshua Tree National Park. That’s perhaps not surprising where the fires were burning houses with lead paint and cars with lead batteries.
Connecting data to people
While the ASCENT data is still preliminary, the researchers released data from the Los Angeles-area sites as the wildfires were raging to inform residents about the specifics of the air pollution around them, complementing the usual AQI data. For example, if particulate material was high, residents could look at the ASCENT data to see if the pollution was due to typical emissions or if it contained urban wildfire toxins, Bahreini said.
The South Coast AQMD recently expanded its air monitoring efforts, deploying mobile monitoring vehicles to identify sites with high levels of toxins and human-made chemicals, as these areas could require further monitoring. Data it captures will be shared with the public via the South Coast AQMD’s website, experts at the agency said.
“Getting the data to people — and getting people to pay attention to the data,” is challenging for air quality networks, said Clay.
Residents could benefit from alerts when there are toxins like lead in the air, she said. For example, a digital screen in town could broadcast the AQI to a community, she suggested.
“[AQI] does show up on some weather apps,” Clay said. “But how much are people staring at weather apps?