Dive Brief:
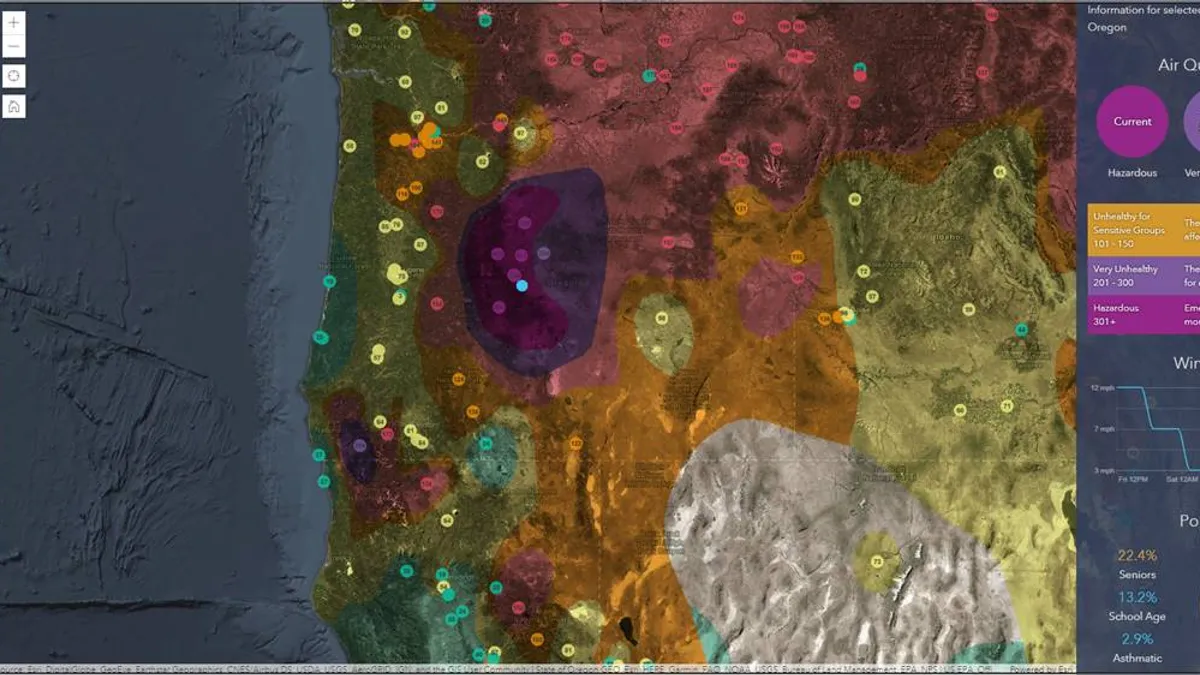
- A new app from GIS mapping company Esri uses data from the federal government to provide information on current air quality, how it might change in the future and its impacts on local communities and vulnerable populations.
- Air Quality Aware, available through ArcGIS Living Atlas of the World, uses the Environmental Protection Agency's (EPA) Air Quality Index to show how hazardous the air is, as well as weather forecasting and wind speed projections from the National Weather Service (NWS) and demographic information from the U.S. Census Bureau. The app then provides insight to users on the current air quality and what it might be for the rest of the day and beyond.
- The app has taken on special significance as California, Oregon and other states battle wildfires and other natural phenomena wrought by the effects of climate change, said Dan Pisut, Esri's Environment content lead for The Living Atlas whose team built the app. And while measuring and forecasting air quality can be complex, he said by using all the data available, planners, residents and local officials can make more informed decisions about whether to go outside.
Dive Insight:
Cities have become increasingly aware of the need to monitor and improve their air quality through curbing emissions, with a January report from Environment America, U.S. Public Interest Research Group (U.S. PIRG) and Frontier Group warning that 108 million Americans face unhealthy air quality. The wildfires in California, and the images of orange skies, have thrown that into stark focus, with experts warning that hazardous air will result in, among other things, a financial crisis and lower worker productivity.
Pisut said the Air Quality Aware app should give greater insight on whether people will be safe to go outside at a certain point, especially as it has data like wind speed forecasting from NWS, which can indicate if smoke will be blown away. He drew on the example of a team member who lives in Maricopa, CA, which has been struggling with poor air.
"As all of the wildfire smoke was coming inland, their air quality was at a level of 400 on the air quality index, which is hazardous," Pisut said. "She's interested in seeing things like, when can I actually get outside? She can't see the blue sky, there is no sky. Is that going to change later today? Is that going to change tomorrow? Are the winds going to shift and allow us to actually see those things?"
Based on the EPA's Air Quality Index, a level of 400 means the air quality is regarded as "hazardous," which is the worst measurement. If the air is "good," it has a reading of between 0 and 50.
For vulnerable populations, which often bear the brunt of the worst impacts of climate change and emissions, the app takes on even more importance, Pisut said. Using Census Bureau statistics, city leaders can see information on asthma sufferers in a certain area, and by using the app can see if the air will be bad too and can adjust their public health efforts accordingly.
Pisut said all the free data available from the federal government has made applications like Air Quality Aware possible, in addition to others from Esri like Hurricane Aware and Drought Tracker. As cities look to make more decisions and projections based on data, not just what they collect themselves but what is available nationally, Pisut said this is an example of what can be done for the good of residents.
"It's amazing the stories that you can tell when you have the ability to intersect all of that different information," Pisut said.


