Dive Brief:
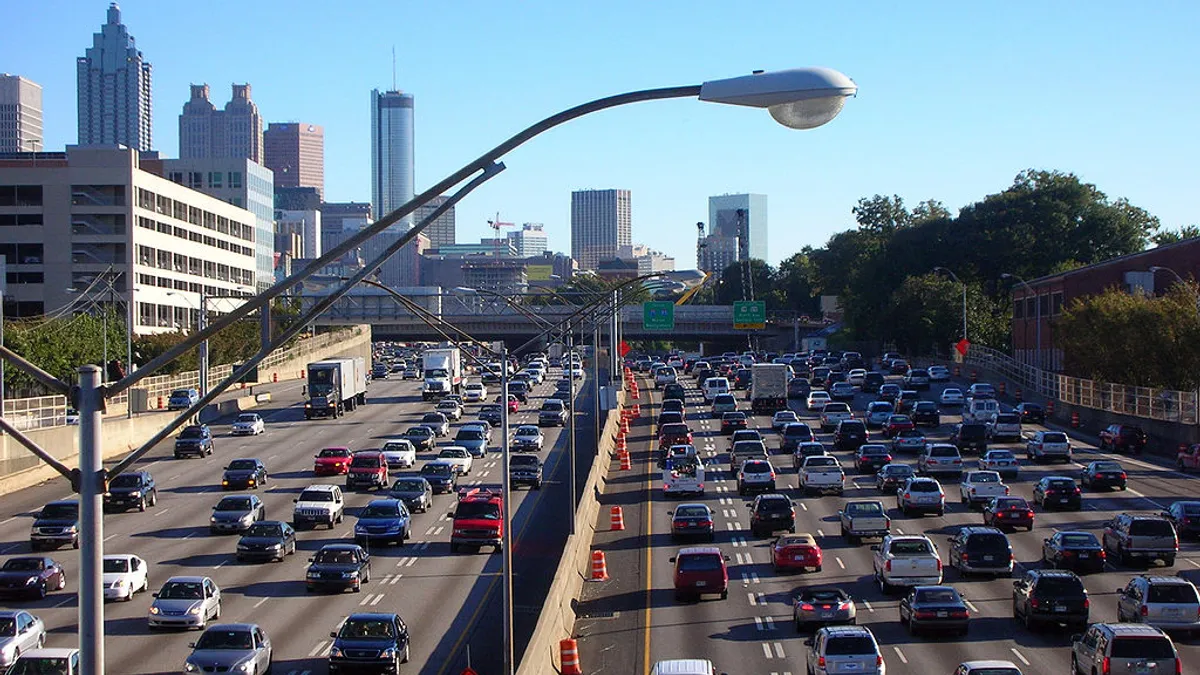
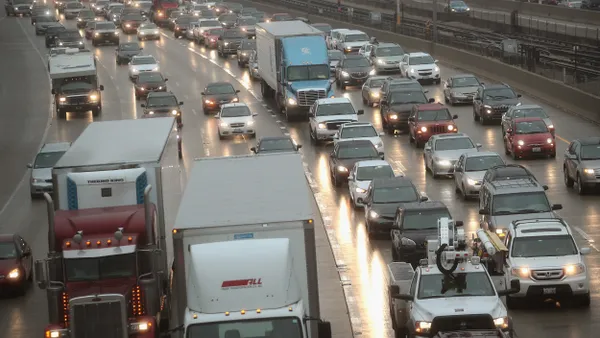
- Analytics platform StreetLight Data has released its 2018 Annual Average Daily Traffic (AADT) for more than 4 million miles of roadway. It’s the fastest the company has released its count of how many cars, trucks and bikes navigate urban and rural roads.
- StreetLight Data uses record locations from smartphones, connected cars and trucks and analyzes the data based on speed, location on the street and land use patterns. The resulting traffic count is given to government and business partners on StreetLight Data’s platform.
- “As transportation is changing more dynamically, the need for more affordable, accurate metrics is bigger than ever,” StreetLight Data CEO Laura Schewel told Smart Cities Dive in an interview.
Dive Insight:
Schewel said that AADT is a “simple, fundamental transportation metric that people need all the time,” but one that has previously been expensive and time-consuming to acquire. Permanent counters need maintenance and are expensive to install, while temporary measures like counting strips can only give data for a few days or weeks at a time. Schewel said that StreetLight Data’s mobile location is akin to a “virtual tube that you lay across a digital road,” which gives more data than ever before. That can be especially valuable for rural roads, where less traffic means that data collection is even harder when done manually or on an ad hoc basis.
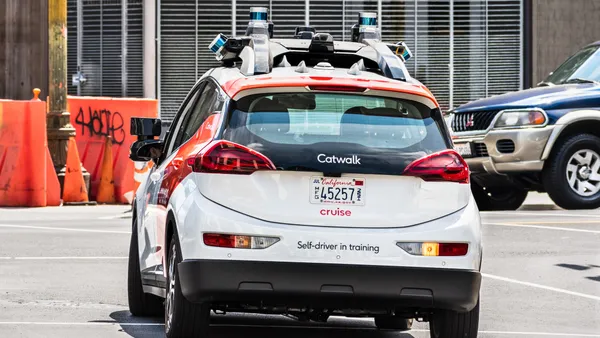
The traffic count is essential for transportation agencies, who use it to know how to direct resources, predict what roads will need maintenance, understand safety statistics and calculate their greenhouse gas emissions. Earlier this year, the platform also added a feature to distinguish bike and pedestrian traffic, which gives planners and businesses a better idea of how people were getting around. A $10 million funding round announced last summer will also help the platform track more data streams, like vehicle emissions and the impact of autonomous vehicles (AVs).
The importance of the data led StreetLight Data to expedite the release of the 2018 statistics; last year, the previous year’s AADT was not released until the fall. The “big computational endeavor” showed how much can be done with data, and sets the stage for StreetLight Data to parse the data over the coming year, including offering monthly and hourly counts and a breakdown of how people are moving across mobility modes.
“A lot of the survey data used for transportation planning was done before Uber was even around,” Schewel said. “That’s an absurd way to be making decisions. The data collection cadence is having to just totally be redone in the light of how fast transportation is changing.”


