We know that poor air quality negatively affects our productivity and health. Those particularly vulnerable are children, elderly and individuals with underlying heath conditions, such as asthma or heart disease.
The burden of air pollution regulation initially fell on the states before the U.S. EPA implemented the Clean Air Act of 1970. Today, more individuals and environmental agencies are involved, and air quality is beginning to be monitored at a hyperlocal level – from county, to city, to street, to yard. This is because research has linked higher concentrations of pollutant emissions to specific locales or stationary sources like heavily trafficked roads, factories or earth-moving activities.
What does this mean for growing cities?
Currently, more than 39 percent of the U.S. population lives in cities with a population of 50,000 or more. The U.S. Census Bureau reports the fastest-growing cities in America, most of which are located in the South and West, are attracting more than 10,000 new inhabitants each year. Urbanization is an opportunity for economic growth, social integration and development of citizens and services; however, it is usually accompanied by increased demands on industry, the environment and transportation. More people mean more air pollution.
By utilizing air monitors with Internet of Things (IoT) technology, smart cities are able to efficiently gather and analyze localized air pollution data across their communities to make better decisions for citizens. For example, studies link traffic pollution to poor academic performance. Urban planners utilizing a network of air quality monitors can obtain insights into the best placement for a new school to minimize student exposure to harmful air.
How does a network of monitors work?
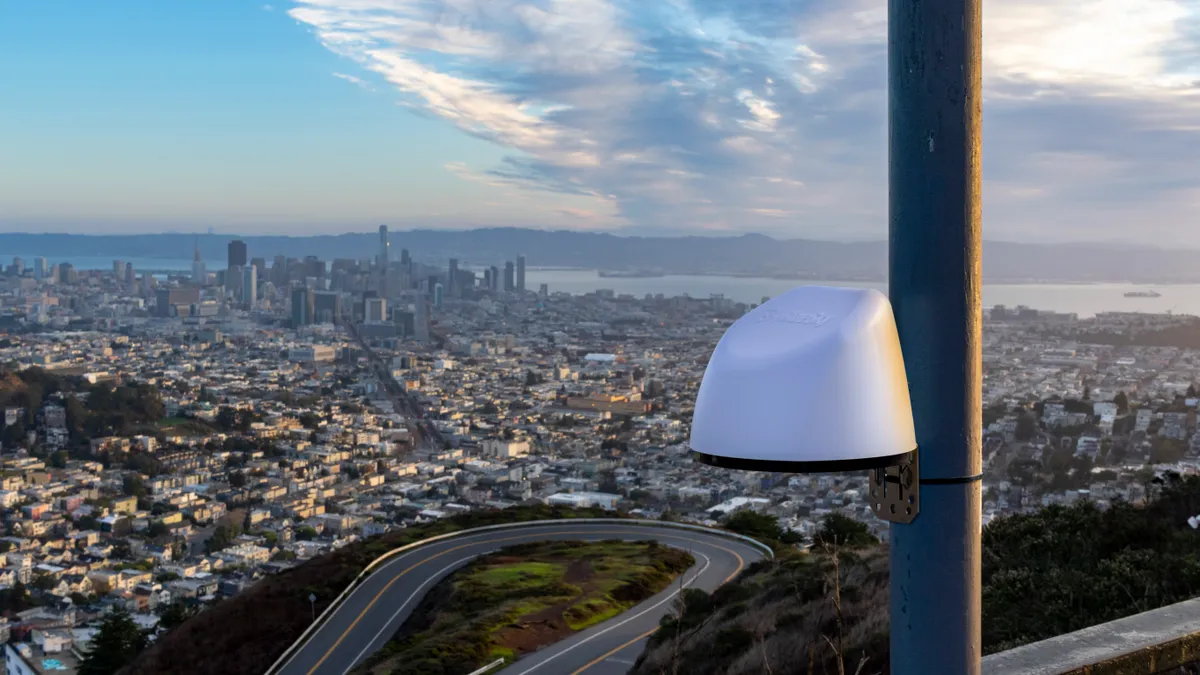
Official air quality measurements are monitored by large, fixed field stations. With advancements in air sensor technology, smaller and more portable monitors are now available, which means more monitors can be placed around a community to increase the spatial resolution of air quality assessments. BlueSky™ Air Quality Monitors are approximately the size of a large grapefruit and so lightweight they can be fastened to a pole or fence with a plastic zip tie.
When connected to Wi-Fi, BlueSky™ monitors report hyperlocal real-time air quality data which can be viewed, shared or downloaded from a secure website. Data including time, temperature, an approximation of the U.S. Air Quality Index (AQI) and PM2.5 mass concentrations are recorded independently by each device on the cloud and an internal memory card, and multiple devices can be linked to the same account or project.
Why should I choose BlueSky™ Air Quality Monitors?
BlueSky monitors are designed by measurement experts from TSI Incorporated, a Minnesota-based company that has set the standards for precision instrumentation since 1961. The team at TSI aimed to develop a connected solution for air monitoring that provided reliable, instantaneous data to urban communities working to minimize air pollution exposure.
Inside the BlueSky monitor is a TSI factory-calibrated PM sensor for precise data. A laser-based light scattering particle sensors simultaneously output PM2.5, PM10, temperature and relative humidity. Equipped with self-diagnostics, device managers are notified of poor sensor performance while maintaining data integrity.
These monitors are easy to integrate into existing infrastructure and the proprietary cloud-based platform, TSI Link™ Solutions, provides secure, remote monitoring. Each device can stream and display real-time live data from the cloud using Wi-Fi without installing software or an app.
To learn more, visit www.tsi.com/bluesky.


